



Managing Process & Product Variations (MPV)
Nature has it that no two things or events are exactly alike. This is known as variation. Products and services, like natural phenomena, can have variability too. However, too much variability in product and service is abhorred by customers. In fact, the ability of a provider to deliver uniform and predictable products is an indication of quality.
The bad news about variations is that they can never be totally eliminated. The good news is that customers have accepted variations to be a fact of life so tolerances have been put in place. Another good news is that events and processes can be controlled so that the resulting product or service doesn’t violate the customers’ tolerable measures. Statistical process control is an initiative to establish, measure, monitor and control process performance through the application of statistics. It attempts to detect abnormalities early enough in order to eliminate assignable causes that result in product defects.
This seminar teaches the statistical approaches in assessing, analyzing and solving variability problems; and when the problem is solved, how to keep the process performing within the control limits.
Objectives: By the end of the seminar the participants would have acquired the following:
- An appreciation of the statistics-based discipline in dealing with product variability issues;
- Statistical techniques in assessment and analysis of variation problems;
- Systematic approach in solving variability problems;
- Statistical techniques in process management and control of variability.
Agenda:
- Nature & Theory of Variations
- Variations in your Products & Processes
- Visualizing a Variation
- Frequency Diagram & Probability
- The Normal Curve
- Dealing with Variation Issues
- Making Inferences & Decisions
- Problem Solving on Variation Issues
- Process Mapping
- Cause & Effect Analysis
- Goal Setting for Variability Control
- Verifying your Solution
- x-bar/R Control Charts
- Process Capabilities Analysis
- Continuous Process Improvement
- Workshop using actual production data
Note: Participants are advised to bring scientific or statistical calculators.
Who should attend: Supervisors, Foremen, Staff & Managers in Production, QA/QC, Industrial Engineering, R & D, Process Audit; Improvement Teams, Maintenance & Engineering, & Training
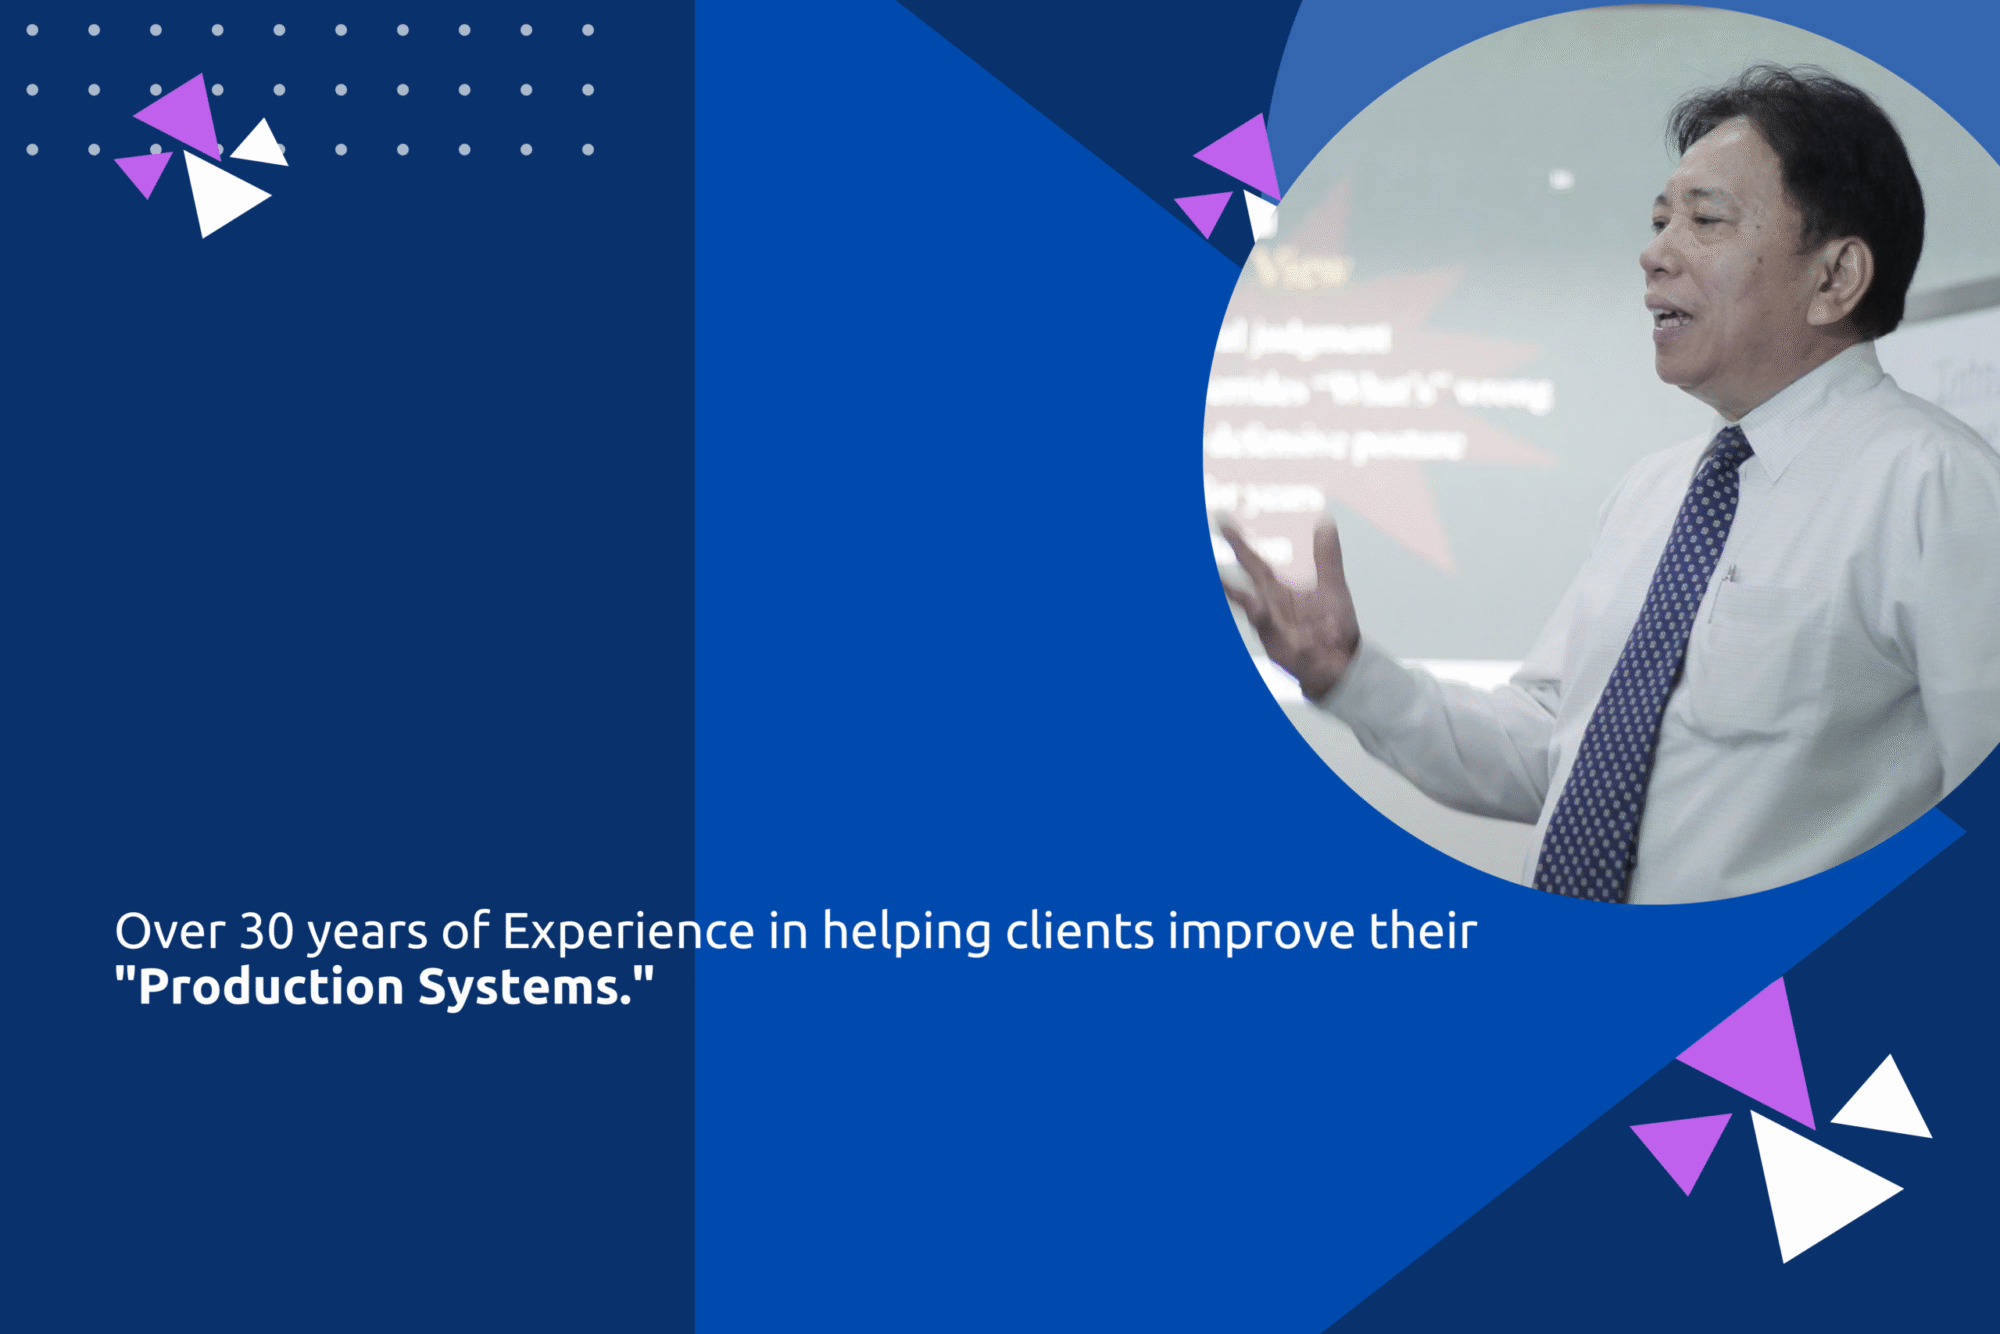
Facilitator: Jose S. Villegas
Note: This seminar is offered face-to-face, in-house or in-plant exclusive runs only. Should you be interested contact us at +639773731180 or email us at kaizen.system@yahoo.com; jsv@kaizenmgtsys.com.